
What we post / Storm Reports
Storm Reports
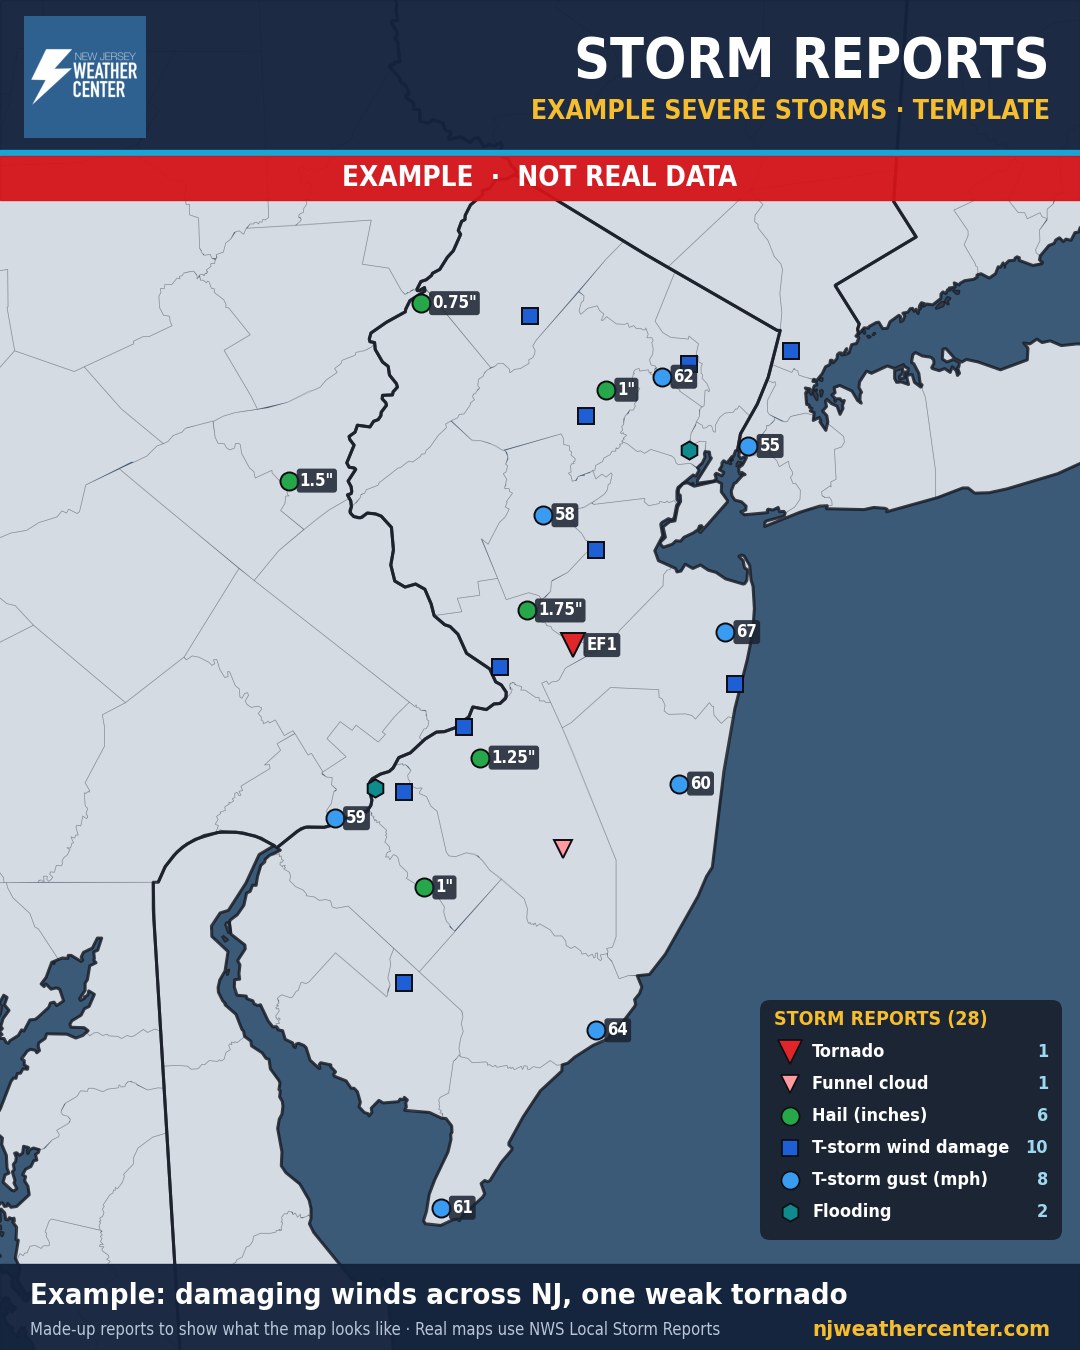
Example map. These reports are made up to show what the map looks like. They are not real reports.
What it shows
What actually happened during and after a storm: tornadoes, hail, damaging winds, strong wind gusts and flooding, plotted where they were reported.
How to read it
- Each symbol is one report. Red triangles are tornadoes, green circles are hail (with the size in inches), blue squares are thunderstorm wind damage and blue circles are measured gusts (in mph).
- The key in the corner shows each type of report and how many there were.
- These are preliminary reports from spotters, emergency managers, the public and weather stations. The National Weather Service checks them later, and some can change.
When we post it
After severe thunderstorms, high wind events and big storms, once the reports are in.
Where the numbers come from
Preliminary Local Storm Reports from the National Weather Service offices in Mount Holly, NJ and Upton, NY. For dangerous weather, always follow official National Weather Service warnings and your local emergency officials.