
What we post / Snowfall Maps
Snowfall Maps
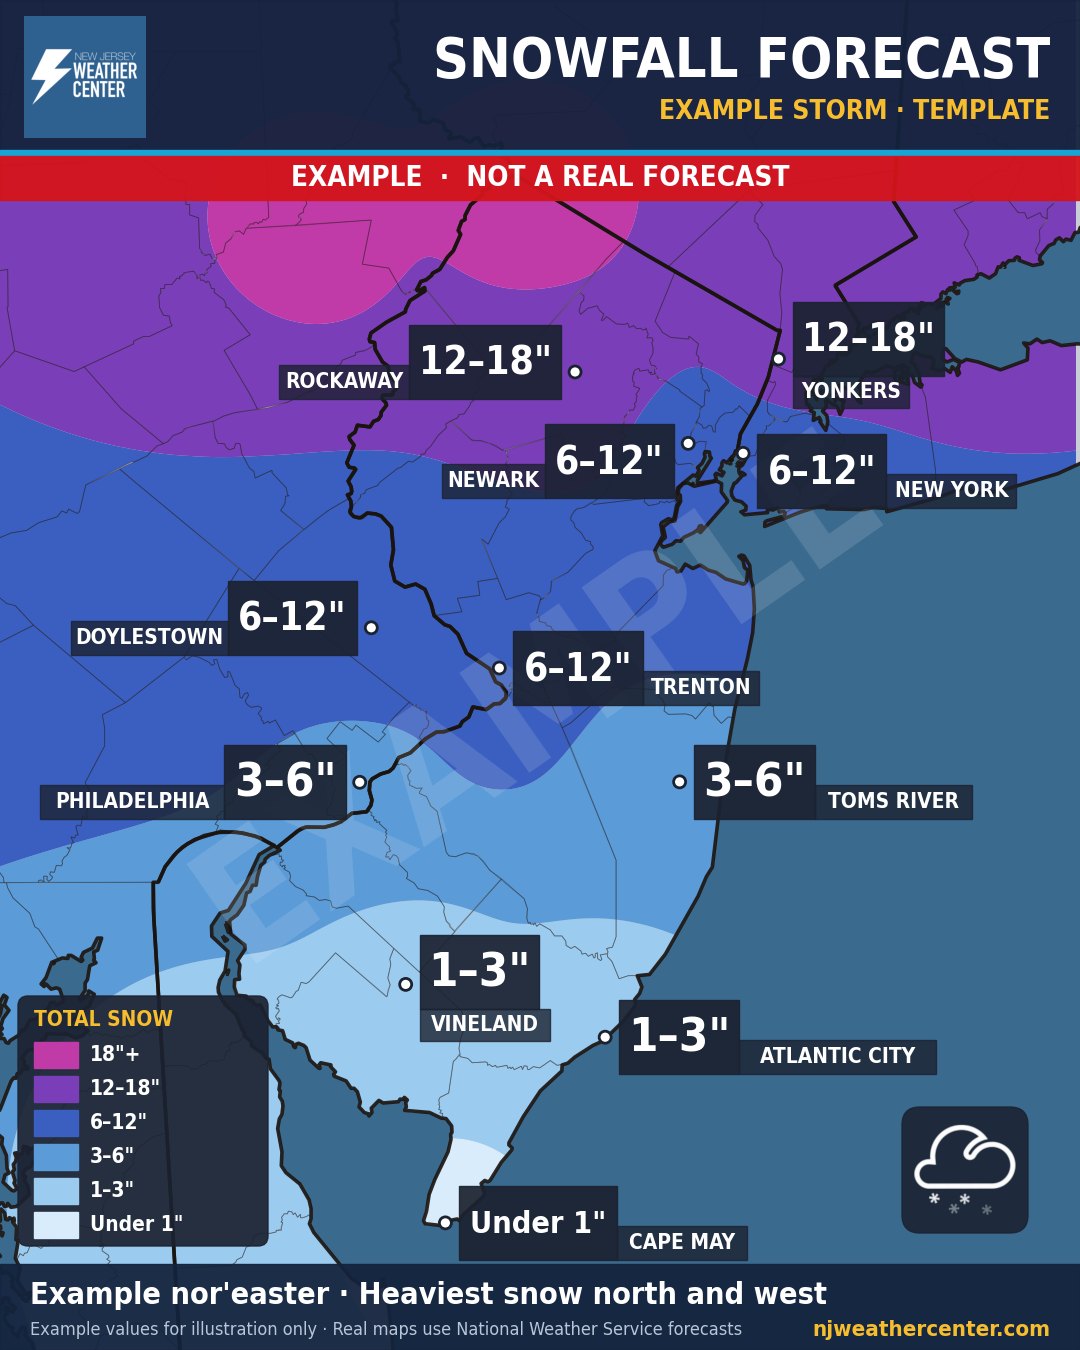
Example map. This storm is made up to show what the map looks like. It is not a real forecast.
What it shows
Who gets how much snow from a storm, where the heaviest bands set up, and where it's more likely to mix or stay light.
How to read it
- The colors are snowfall ranges. The key in the corner shows each range, from under 1" to 18"+.
- City boxes show the expected range for that city.
- Totals are for the whole storm unless the map says otherwise.
When we post it
Starting a few days before a winter storm, then updated as it gets closer and the forecast firms up.
Where the numbers come from
Snowfall amounts come from the National Weather Service forecast. We never make up totals. For dangerous weather, always follow official National Weather Service warnings and your local emergency officials.