
What we post / Severe Weather
Severe Weather
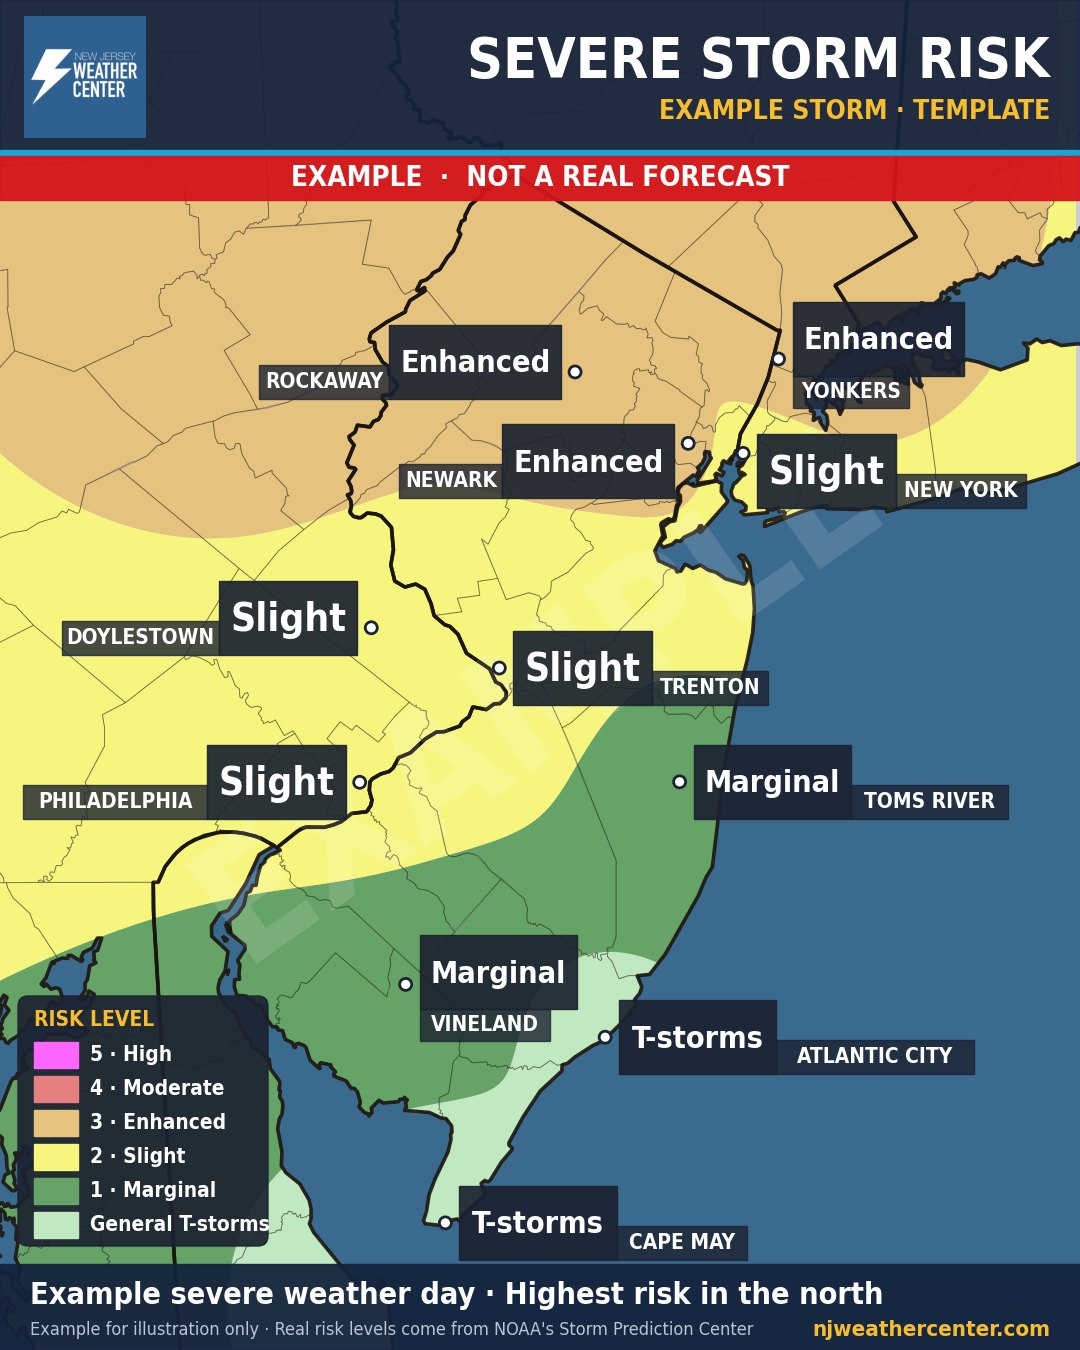
Example map. This storm is made up to show what the map looks like. It is not a real forecast.
What it shows
Where strong to severe thunderstorms are most likely, and what they could bring: damaging wind, hail, flooding downpours or, rarely, a tornado.
How to read it
- The colors follow the national 1-to-5 risk scale: 1 Marginal, 2 Slight, 3 Enhanced, 4 Moderate, 5 High.
- "General T-storms" means regular thunderstorms are possible but severe storms aren't expected.
- Even a level 1 or 2 day can produce a damaging storm, so watch for warnings.
When we post it
On days with a severe weather risk in our area.
Where the numbers come from
Risk levels come from NOAA's Storm Prediction Center, with details from the National Weather Service. For dangerous weather, always follow official National Weather Service warnings and your local emergency officials.