
What we post / Rainfall Totals
Rainfall Totals
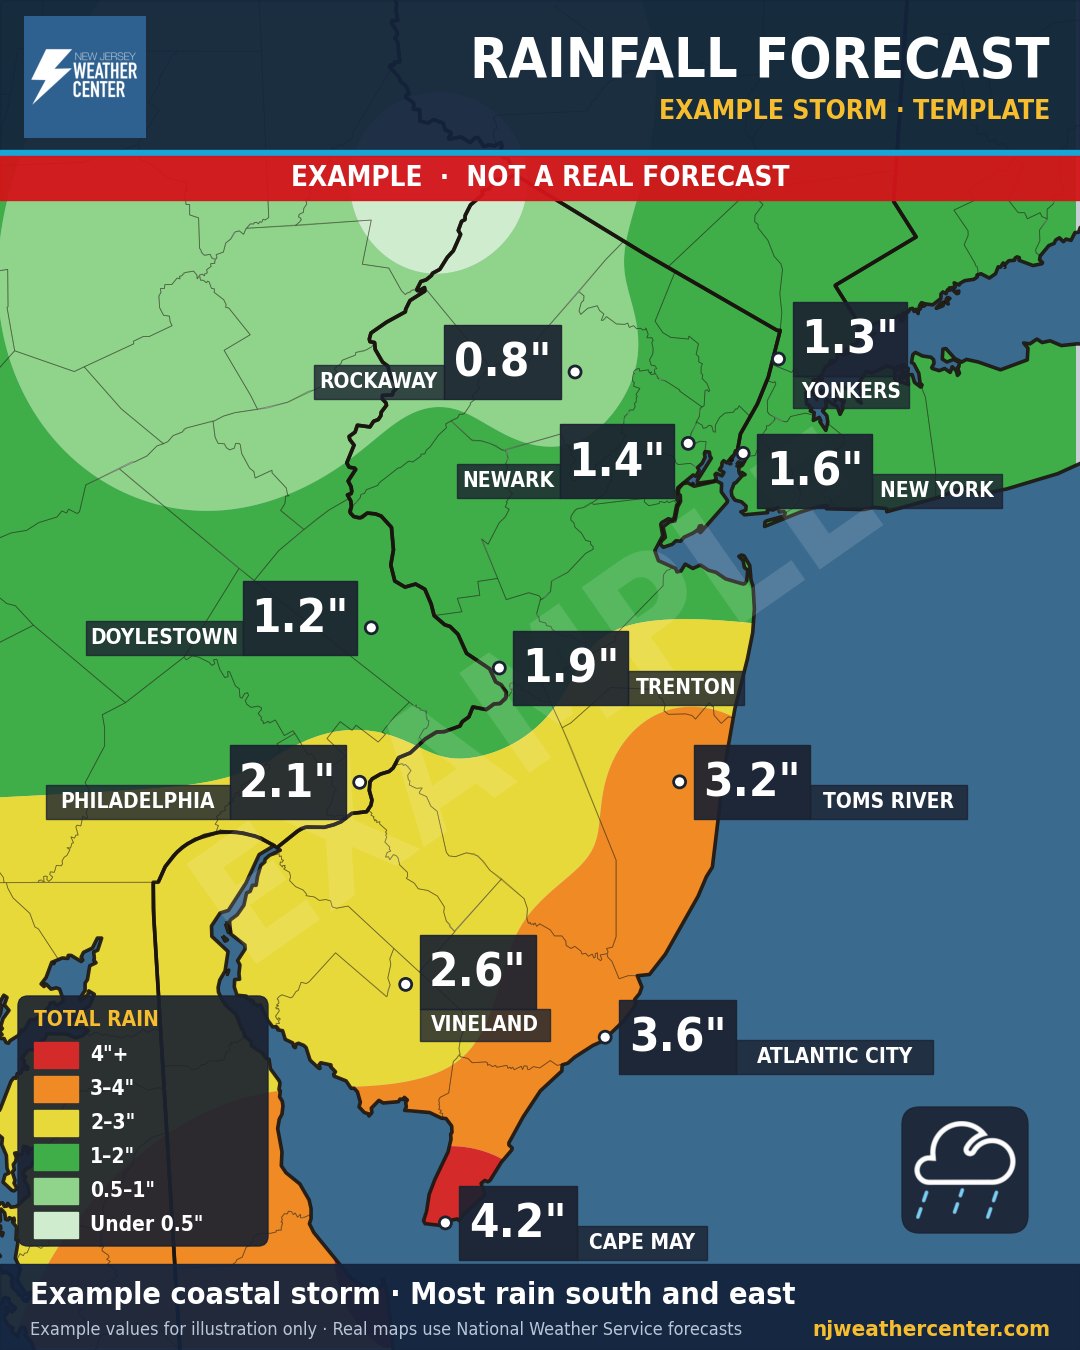
Example map. This storm is made up to show what the map looks like. It is not a real forecast.
What it shows
How much rain to expect from a storm, and where the heaviest totals and flooding risk are.
How to read it
- The colors are rainfall ranges in inches. The key shows each range.
- City boxes show the expected total for that city.
- Heavier totals in a short time raise the flood risk, so check for NWS Flood Watches and Warnings.
When we post it
Before soaking rainstorms, nor'easters and tropical systems.
Where the numbers come from
Rainfall amounts from the National Weather Service forecast. For dangerous weather, always follow official National Weather Service warnings and your local emergency officials.