
What we post / Heat Index & Wind Chill
Heat Index & Wind Chill
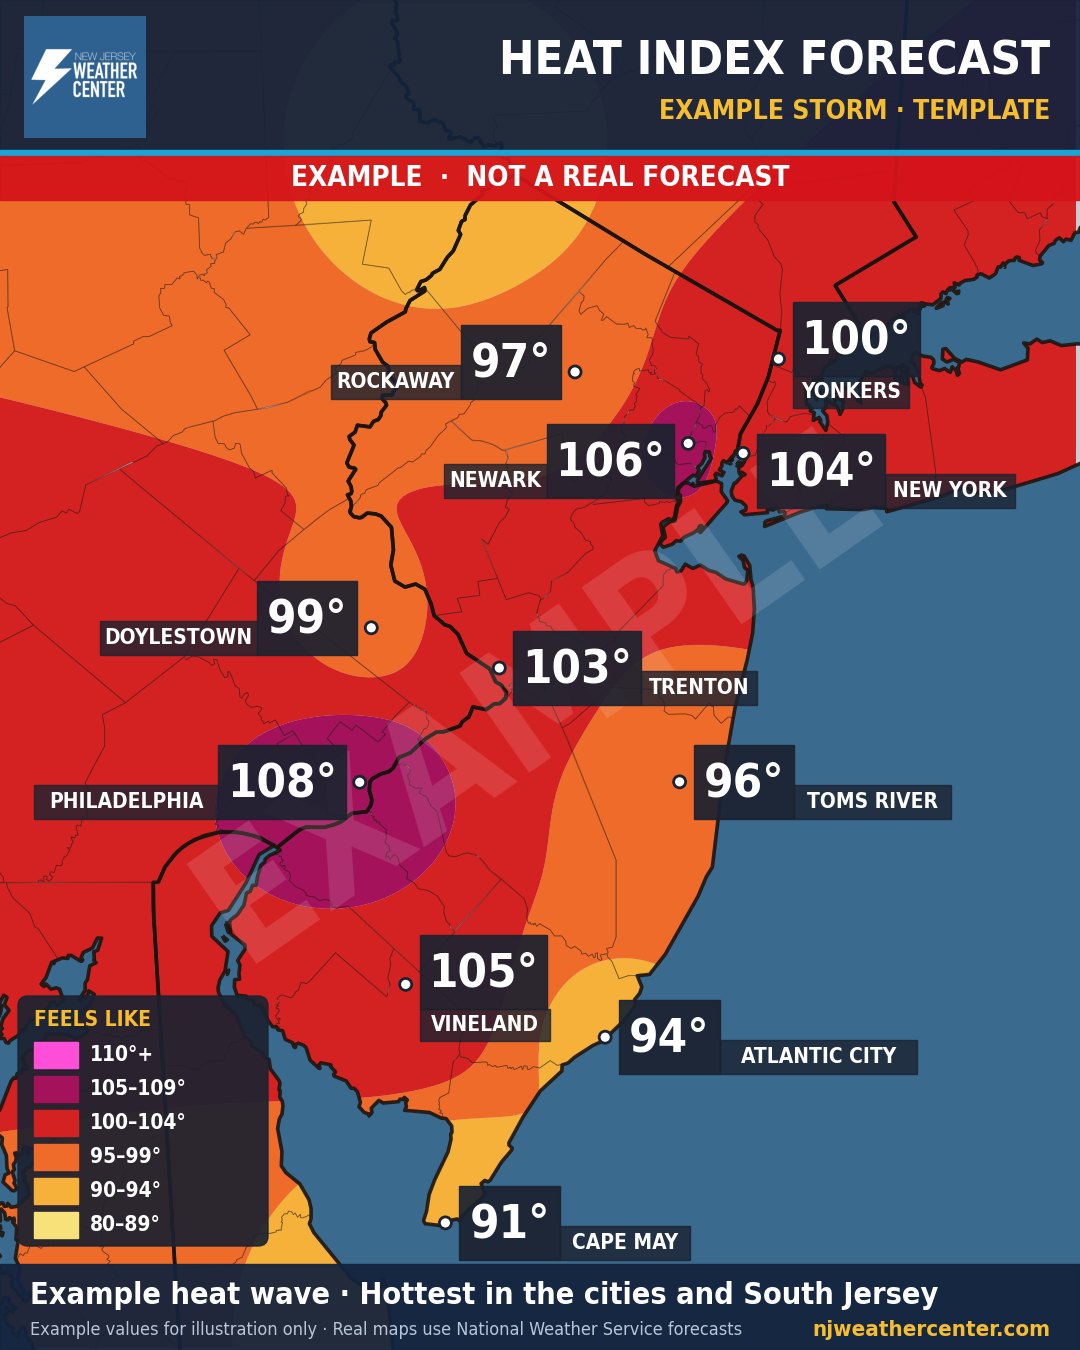
Example map. This storm is made up to show what the map looks like. It is not a real forecast.
What it shows
What it actually feels like outside when it gets extreme: the heat index in summer (heat plus humidity) and the wind chill in winter (cold plus wind).
How to read it
- City boxes show the "feels like" temperature in °F.
- The colors are feels-like ranges. The key shows each one.
- Cities and South Jersey usually feel the worst heat, and the northwest hills get the coldest wind chills.
When we post it
During heat waves and arctic blasts.
Where the numbers come from
Heat index and wind chill forecasts from the National Weather Service. For dangerous weather, always follow official National Weather Service warnings and your local emergency officials.