
Long range · Sat, Nov 21, 2026 (for Nov 29–Dec 5)
Early December looks warmer than normal, with a wetter lean
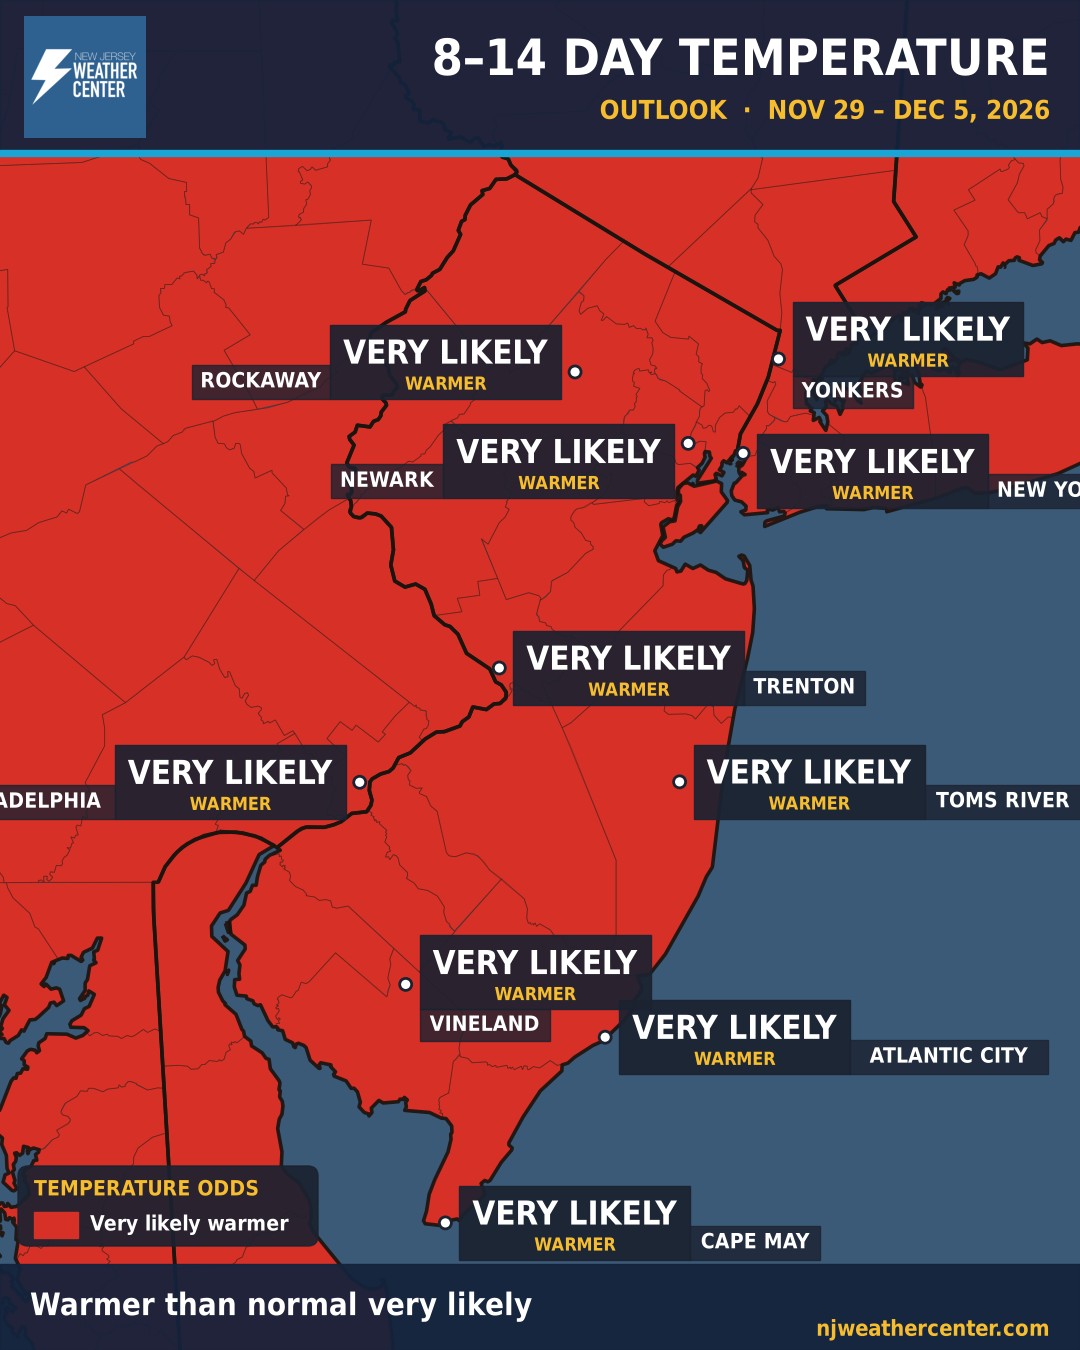
This is the big-picture look at Nov 29–Dec 5. It's not a day-by-day forecast. Think of it like the odds on a game: NOAA's Climate Prediction Center gives the chance that the week as a whole runs warmer, colder, wetter or drier than normal for this time of year.
Temperatures: Warmer than normal is very likely for all of us, from Rockaway and NYC down to Cape May.
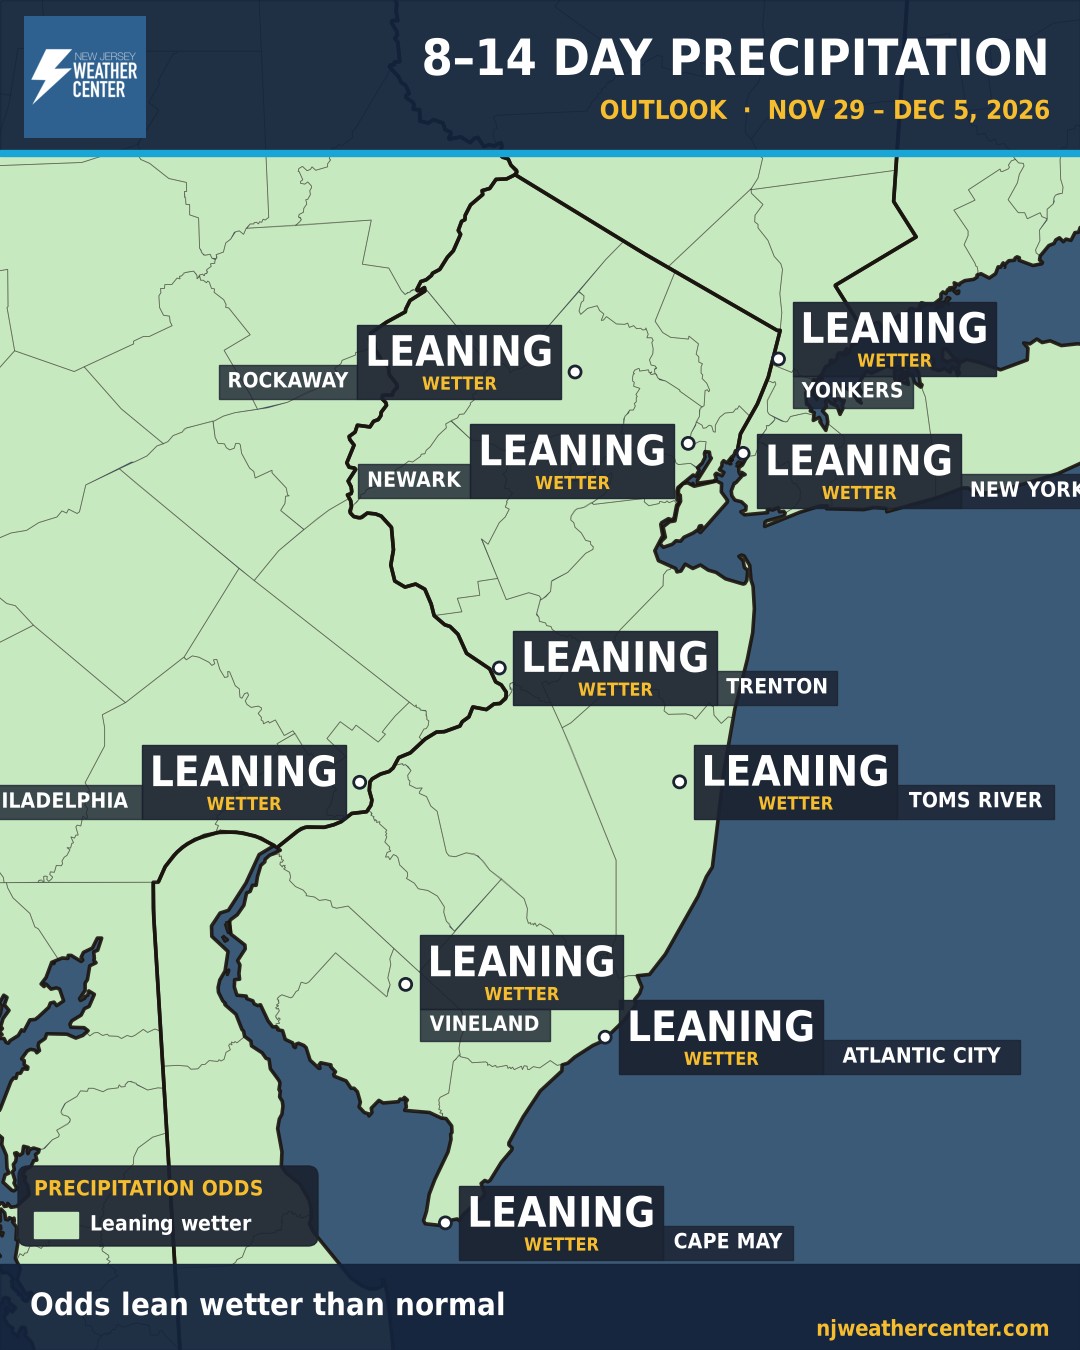
Rain: The odds lean wetter than normal for all of us, from Rockaway and NYC down to Cape May. These are odds for the week as a whole, not a promise for any one day.
What it means for your town
| Town | Temperature, Nov 29–Dec 5 | Precipitation, Nov 29–Dec 5 |
|---|---|---|
| Rockaway | Very likely warmer than normal | Leaning wetter than normal |
| Yonkers | Very likely warmer than normal | Leaning wetter than normal |
| Newark | Very likely warmer than normal | Leaning wetter than normal |
| New York | Very likely warmer than normal | Leaning wetter than normal |
| Trenton | Very likely warmer than normal | Leaning wetter than normal |
| Philadelphia | Very likely warmer than normal | Leaning wetter than normal |
| Toms River | Very likely warmer than normal | Leaning wetter than normal |
| Vineland | Very likely warmer than normal | Leaning wetter than normal |
| Atlantic City | Very likely warmer than normal | Leaning wetter than normal |
| Cape May | Very likely warmer than normal | Leaning wetter than normal |
New to these maps? Here's how to read the 8–14 day outlook. For the days before that, see the 7-day forecast.
Outlook: NOAA Climate Prediction Center, issued Sat, Nov 21, for Nov 29–Dec 5. Maps: NJ Weather Center.