
Early November looks warmer than normal, with a wetter lean
Archived post. This was posted Fri, Oct 23, 2026 (for Oct 31–Nov 6) and has been replaced by newer information. It's kept for reference, not current conditions. For the latest, see the homepage.
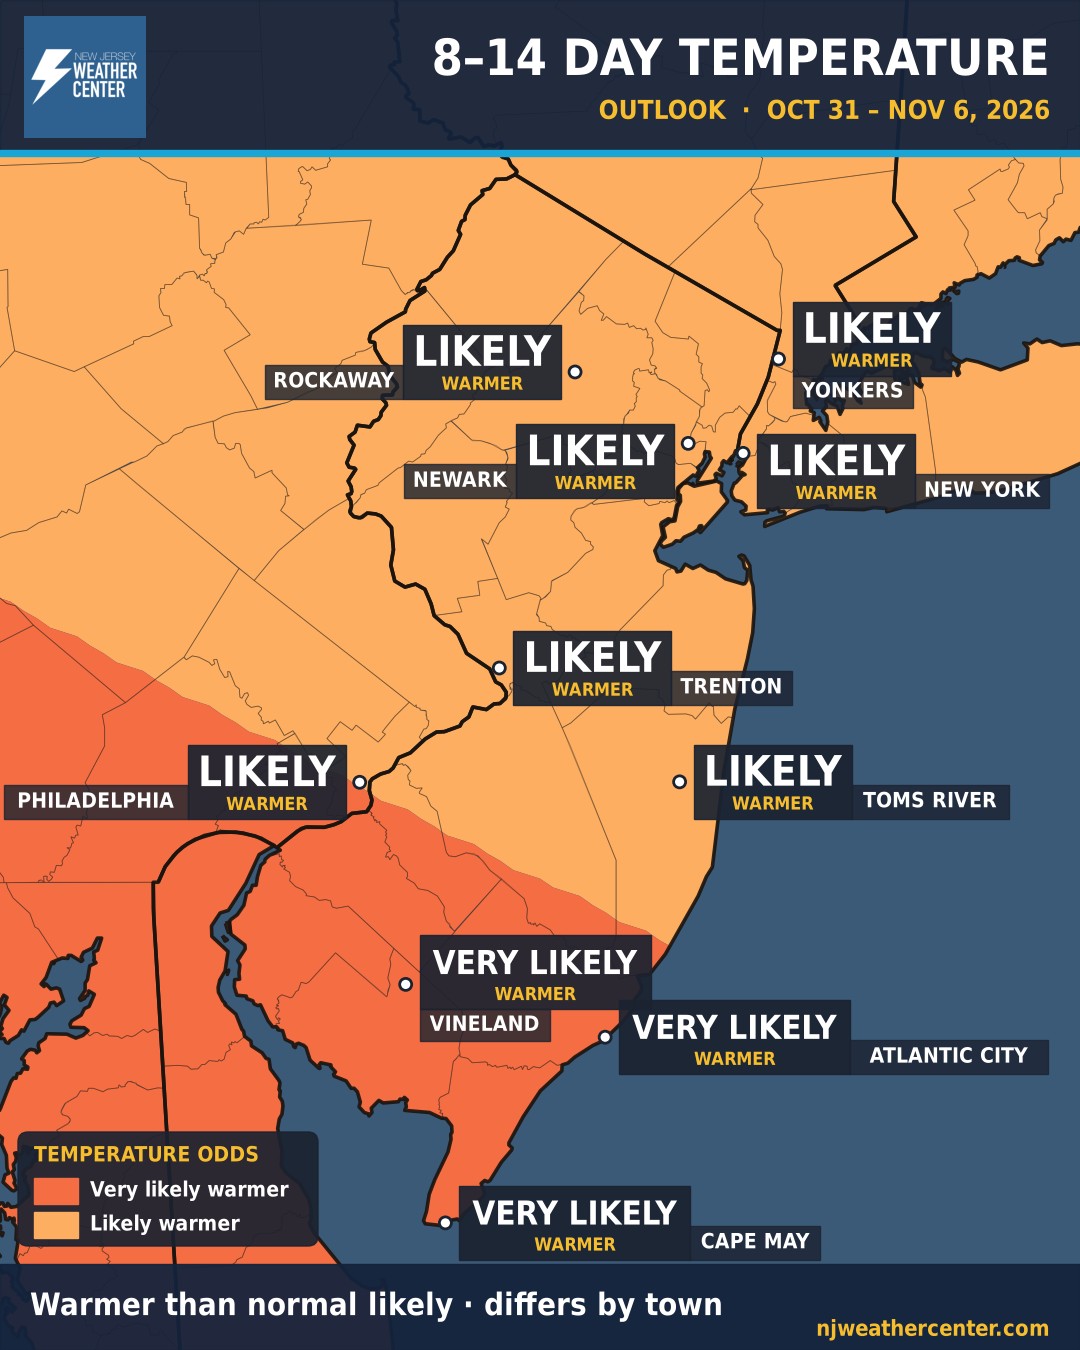
This is the big-picture look at Oct 31–Nov 6. It's not a day-by-day forecast. Think of it like the odds on a game: NOAA's Climate Prediction Center gives the chance that the week as a whole runs warmer, colder, wetter or drier than normal for this time of year.
Temperatures: Warmer than normal is likely for Rockaway, Yonkers, Newark, New York, Trenton, Philadelphia and Toms River; warmer than normal is very likely for Vineland, Atlantic City and Cape May.
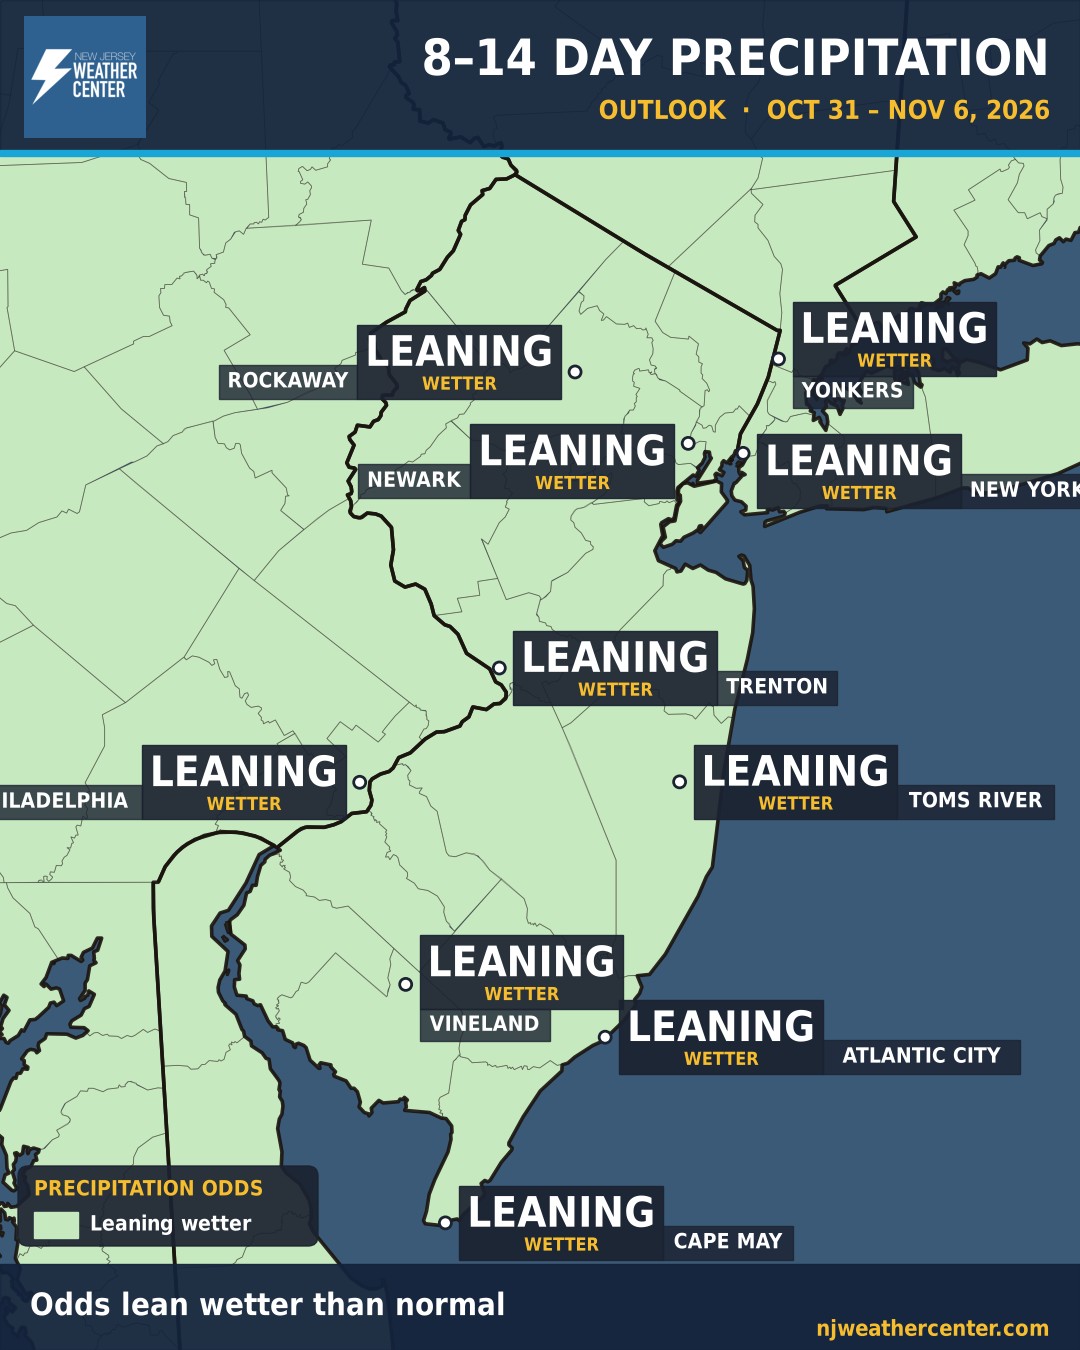
Rain: The odds lean wetter than normal for all of us, from Rockaway and NYC down to Cape May. These are odds for the week as a whole, not a promise for any one day.
What it means for your town
| Town | Temperature, Oct 31–Nov 6 | Precipitation, Oct 31–Nov 6 |
|---|---|---|
| Rockaway | Likely warmer than normal | Leaning wetter than normal |
| Yonkers | Likely warmer than normal | Leaning wetter than normal |
| Newark | Likely warmer than normal | Leaning wetter than normal |
| New York | Likely warmer than normal | Leaning wetter than normal |
| Trenton | Likely warmer than normal | Leaning wetter than normal |
| Philadelphia | Likely warmer than normal | Leaning wetter than normal |
| Toms River | Likely warmer than normal | Leaning wetter than normal |
| Vineland | Very likely warmer than normal | Leaning wetter than normal |
| Atlantic City | Very likely warmer than normal | Leaning wetter than normal |
| Cape May | Very likely warmer than normal | Leaning wetter than normal |
New to these maps? Here's how to read the 8–14 day outlook. For the days before that, see the 7-day forecast.