
Weather 101 / Severe
Marginal, Slight, Enhanced, Moderate, High: How to Read the Severe Weather Risk Levels
On stormy days you'll see a map of the U.S. shaded in green, yellow, orange, red and magenta, with words like "Slight Risk" or "Enhanced Risk." That's the convective outlook from the Storm Prediction Center (SPC), the part of the National Weather Service that forecasts severe thunderstorms and tornadoes for the whole country. It's the first heads-up that a dangerous storm day could be coming, often days ahead.
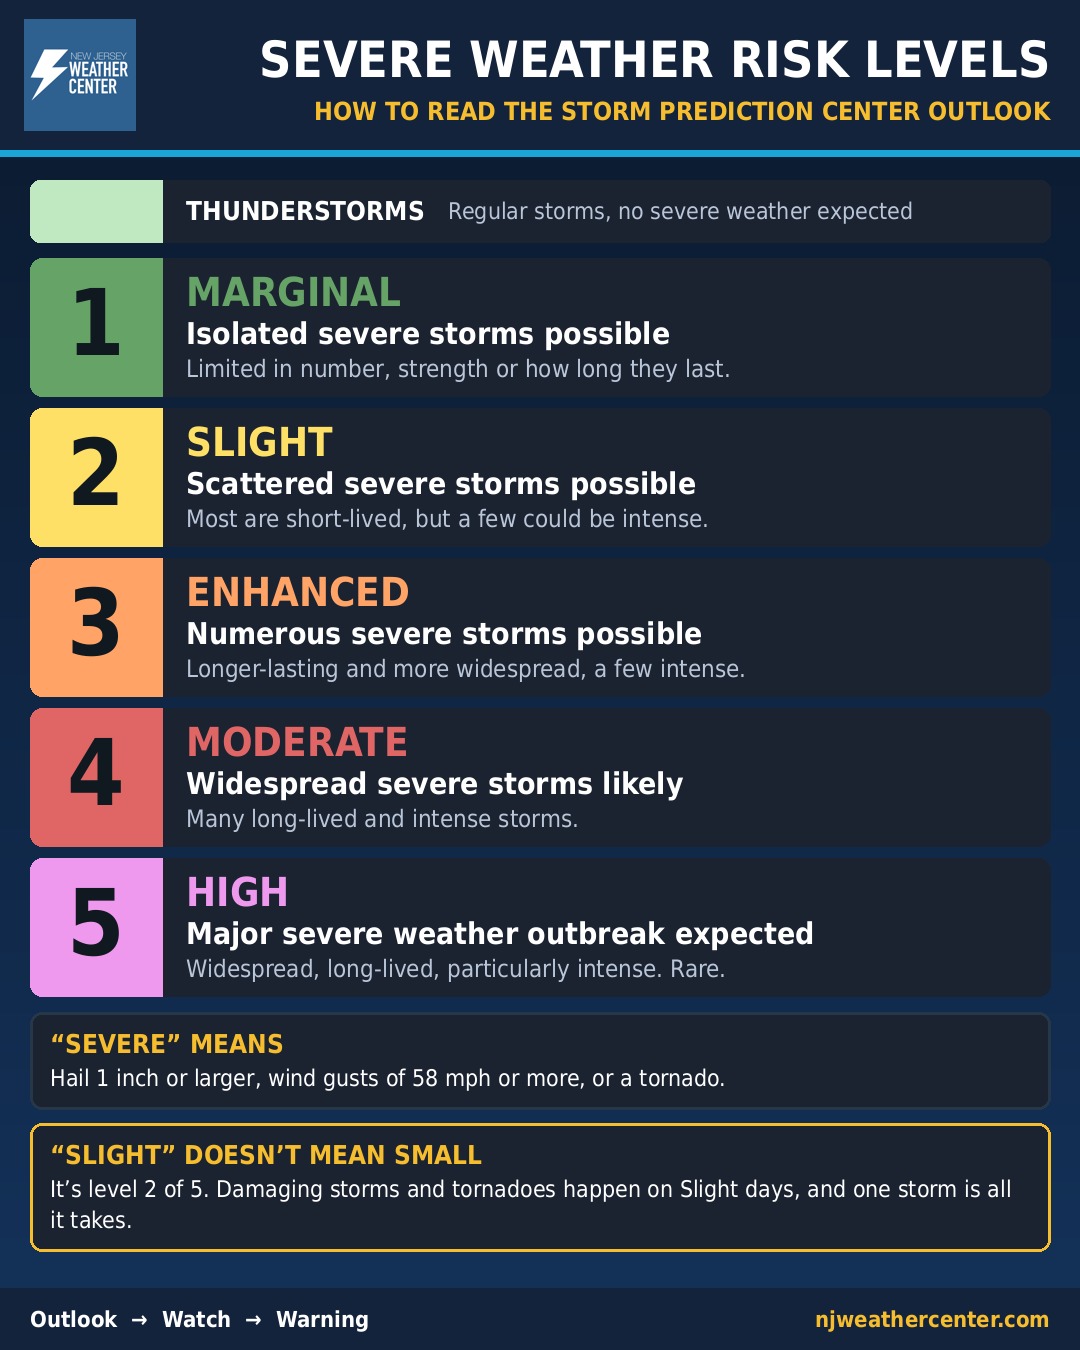
What counts as "severe"
A thunderstorm is officially severe when it produces at least one of these:
- Hail 1 inch across or larger (about the size of a quarter)
- Wind gusts of 58 mph or stronger
- A tornado
Lightning and heavy rain are dangerous too, but they don't make a storm "severe" by this definition. Our guides to lightning safety and flash flooding cover those.
The five levels
- Thunderstorms (light green, no number): regular thunderstorms are expected, but severe ones aren't.
- 1 - Marginal (dark green): isolated severe storms are possible. They'd be limited in how long they last, how many there are, or how strong they get.
- 2 - Slight (yellow): scattered severe storms are possible. Most will be short-lived or spread out, but a few intense storms could happen.
- 3 - Enhanced (orange): numerous severe storms are possible, lasting longer and covering more area, with a few intense ones.
- 4 - Moderate (red): widespread severe storms are likely, and many of them will be long-lived and intense.
- 5 - High (magenta): a major severe weather outbreak is expected: widespread, long-lived and particularly intense storms. High risk days are rare.
How to read it
The levels are built on probabilities: the chance of severe weather happening within 25 miles of any spot in the shaded area. That's why a level says more about how many severe storms to expect and how organized they'll be than about whether your own street gets hit.
- "Slight" doesn't mean small. It's level 2 of 5, and plenty of damaging storms and tornadoes happen on Slight and Enhanced days.
- A low level can still mean a bad storm for you. A Marginal day might bring only one or two severe storms, but if one of them hits your town, it's just as dangerous.
- Look for the details. The SPC also maps the separate chances of tornadoes, damaging wind and large hail. Since March 2026, it also marks areas where any storms that do form could be especially strong, even when the overall chance is low.
- It changes. Outlooks go out up to eight days ahead and are updated several times a day. The levels you see three days out often move by the day of the storm.
How often New Jersey gets the top levels
We counted every day from 2002 through November 12, 2026 that any part of New Jersey was inside a Storm Prediction Center risk area of Enhanced or higher, counting each day once at its highest level:
- High (5): never. Not one day since at least 2002.
- Moderate (4): 19 days, and only one of them since 2013: May 15, 2018. The busiest year was 2008, with four.
- Enhanced (3): 42 days since the level was introduced in October 2014, about four a year. The most in one year was six, in 2019.
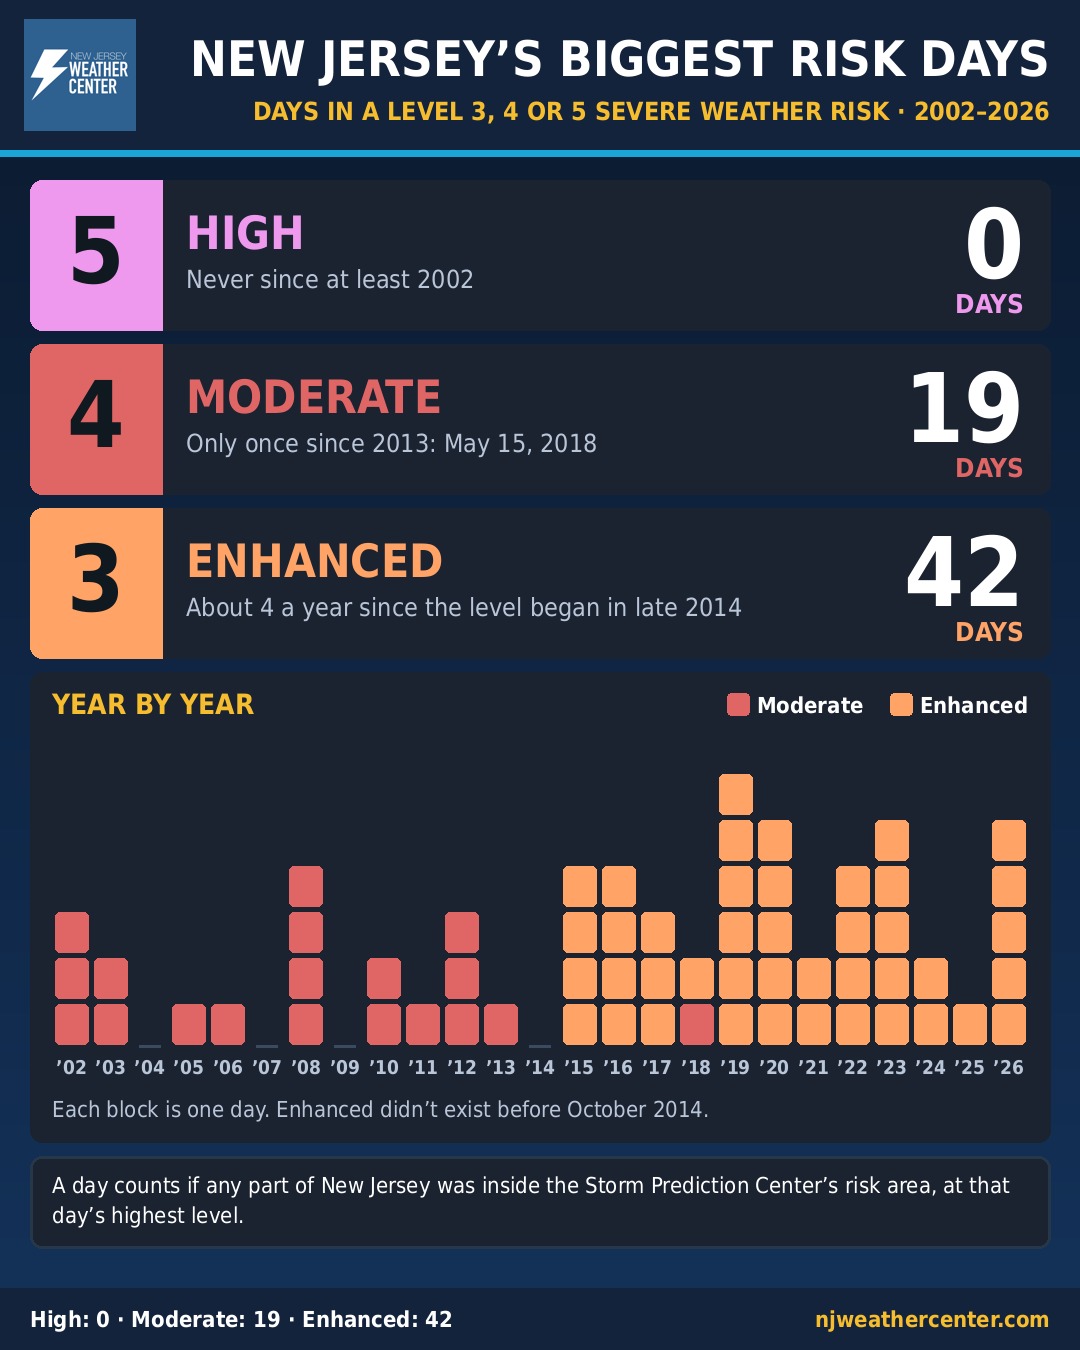
So for us, an Enhanced day is a big deal, and a Moderate has become very rare. A few of the archive's midday outlooks from 2002 and 2003 are missing, so the counts for those two years could be slightly low.
Outlook, then watch, then warning
Think of it as a funnel that narrows as the storms get closer:
- Outlook (days to hours ahead): severe storms could happen in this region. Keep an eye on the forecast.
- Watch (hours ahead): conditions are right for severe storms or tornadoes in this area. Know where you'd go. More in Watch vs. Warning vs. Advisory.
- Warning (minutes ahead): a severe storm or tornado is happening or about to. Take action now. See tornadoes in New Jersey for where to shelter.
When a watch or warning is issued for any of our counties, our site posts a map of it automatically at the top of the homepage.
- Storm Prediction Center: Day 1, 2 and 3 convective outlooks
- Storm Prediction Center: about SPC convective outlooks
- National Weather Service: SPC adds conditional intensity to its outlooks (2026)
- National Weather Service: severe thunderstorm safety
- Iowa Environmental Mesonet: archive of SPC convective outlooks (New Jersey day counts are our own tally of this archive)
For dangerous weather, always follow official National Weather Service warnings and your local emergency officials.